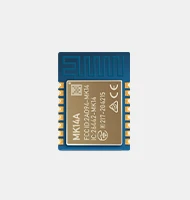
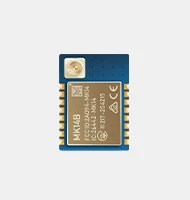
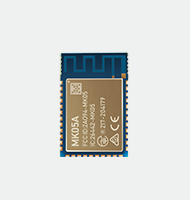
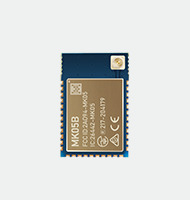
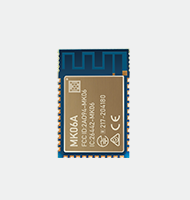
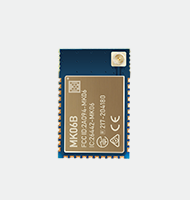
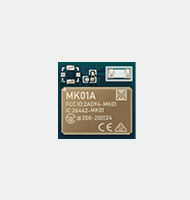
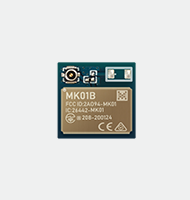
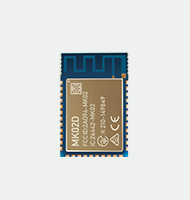
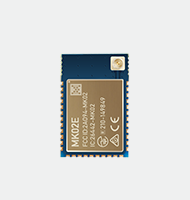
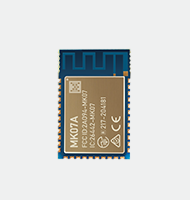
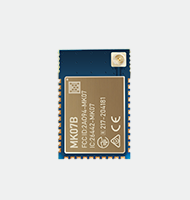
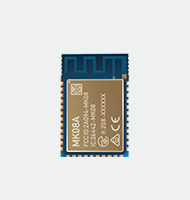
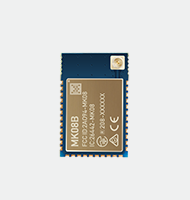
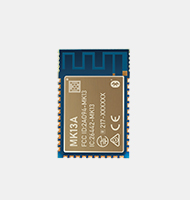
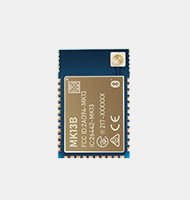
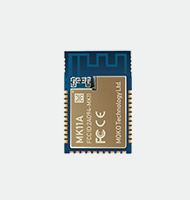
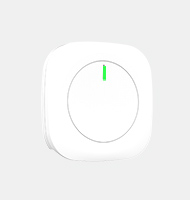
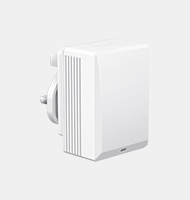
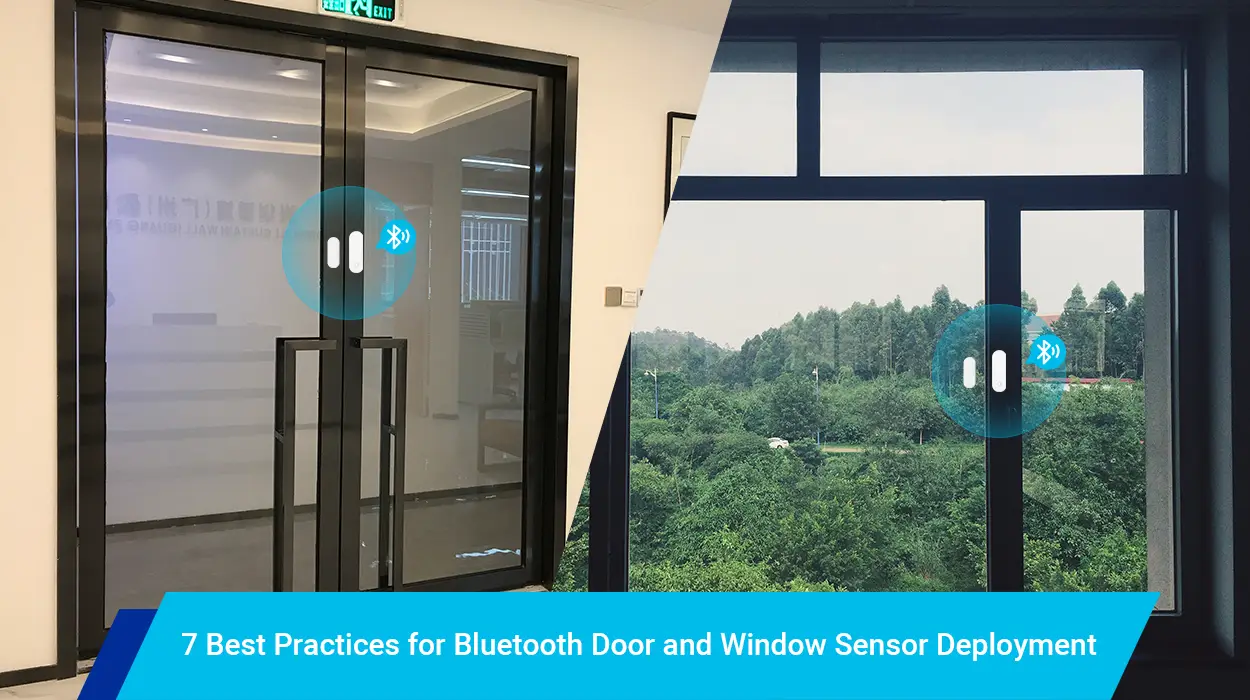
In pig production management, there is a lot of daily movement of pig, semen, supplies, feed, assets, and people between sites within farm sites and between non-production sites (e.g. feed plant, car washing station, office, and warehouse). These movements themselves carry varying degrees of risk of disease transmission and is the potential to result in severe consequences for animal productivity and business performance. The Pig Farm programme Bluetooth Beacon system is designed to capture movement records of people and assets within and between sites in order to more objectively assess the risk of disease introduction and transmission associated with mobility.
The components of the beacon system in pig production
The pig flow diagram is shown in Figure 1. The Bluetooth beacon system consists of six large sow farms and sells weaned piglets to farmer clients. Pig A is A closed feedlot that produces replacement animals for five other commercial pig farms. All semen comes from outside boar species. The system also has feed mills and truck cleaners.
![]()
The architecture of Beacon System
The system consists of the following Bluetooth beacon system components (Figure 2)
- Battery-powered Bluetooth Low Energy (BLE) beacons transmit BLE signals
Location beacons placed in physical locations
Asset beacons attached to physical assets
- Battery-powered Personnel sensors are carried by personnel to detect the BLE signal of locations and assets, and then transmit the detection data to the gateway.
- System application installed in the smartphones of personnel to detect the BLE signal of locations and assets, and then the detection data will be transmitted to the gateway.
- Gateway receives data from the sensor and connects to the cellular router via an Ethernet cable
- Ethernet cable connect to the gateway and transit data to the cloud
- Cloud receives data from Ethernet cable, including dash board and control panel(Access through an Internet browser with user login credentials on Personal computer, laptop, and smartphone)
![]()
Installation of Bluetooth Beacon system
At each animal production site, the area is first defined as the living space for live animals. Each area usually represents a complete barn or space for breeding, gestation, and childbirth. For other areas of the farm, the defined area represents specific rooms and work areas.
Then install location beacons in each area, locator beacon is set to send signals within a radius of 20m, and the number of location beacons placed in the position of each zone is not identical, it depends on the dimensions length x width of the zone. Important assets are marked as asset beacons, which are set to send signals within a radius of 5 meters.
Sensor charging stations are installed in the offices of each site, and all system personnel wears Bluetooth beacon sensors at work every day. Cellular routers with additional gateways are installed at critical locations, and signs displaying relevant messages and reminders are installed at high-traffic locations visible within each site.
When the beacon sensor arrives within range of the gateway-router tandem, the data captured by the sensor is automatically transmitted to a cloud platform where the data can be accessed and analyzed using visual component dashboards and reports to assign a risk level (0-10) to each zone-zone movement pair (Figure 3). The assigned level is selected based on the risk estimates that move between two different regions, which correspond to their respective regional characteristics.
![]()
Here are some examples of lower and higher-risk movements:
• The risk of moving from the gestation area to the loading chute area is relatively low
• There is a relatively high risk of transfer from the isolation room to the pregnancy bay
The sensor detects the location beacon signal and records the ID, date, and time as the detection activity in the area when the person carrying the sensor locator beacon is within the range of the defined area and holds the area specified for a period of time. The time that the sensor recording detection events are a variable specified by the administrator, depending on where the region and location beacons are located.
When the person carrying the sensor comes within range of the asset beacon, the sensor detects the asset beacon signal and records the ID, date, and time as detection events. When a person carrying a sensor and a beacon marker asset enters the location beacon range of a defined region, the sensor records asset events within the region.
Discussion
The Bluetooth beacon system continuously records and evaluates the flow of people and assets, and continues to update and adjust the hardware, software, risk levels, and protocols as necessary, based on user feedback and project observations.
Figure 4 shows the personnel and the two forms of the mobile visualization example, arrows, and heat movement arrows indicate the source (sow farms A office) to the destination (give birth and pregnancy) mobile, during this period the number of mobile display in the target region (arrow tip) arrows corresponds to the corresponding zone – color Zone movement specifies the risk level. The color of the target area on the heat map format corresponds to the movement numbers in the installed period, with warmer colors (e.g., red) referring to more movements than cooler colors (e.g., green).
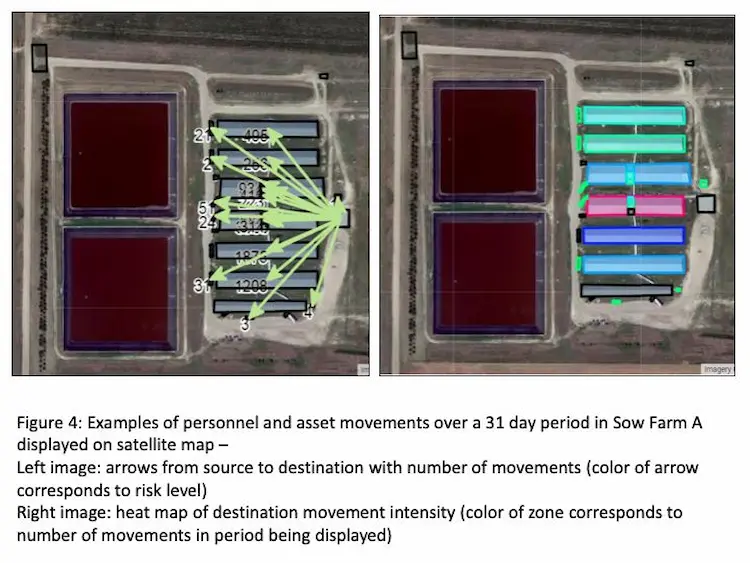
Figure 5 is an example of a time series diagram for the daily zone-zone movement of people and assets. Figure 6 is an example chart for a week and an hour. The daily movement risk levels are shown as stacked bars in Figures 5 and 6. As this is the first initial assessment of this type of beacon system implemented on the technology platform, it is not possible to determine the expected level, range, and distribution of mobile VAR.
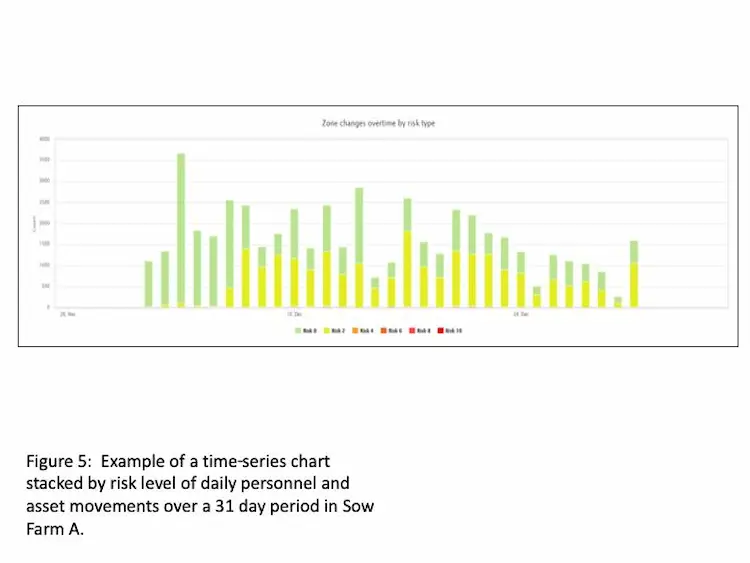
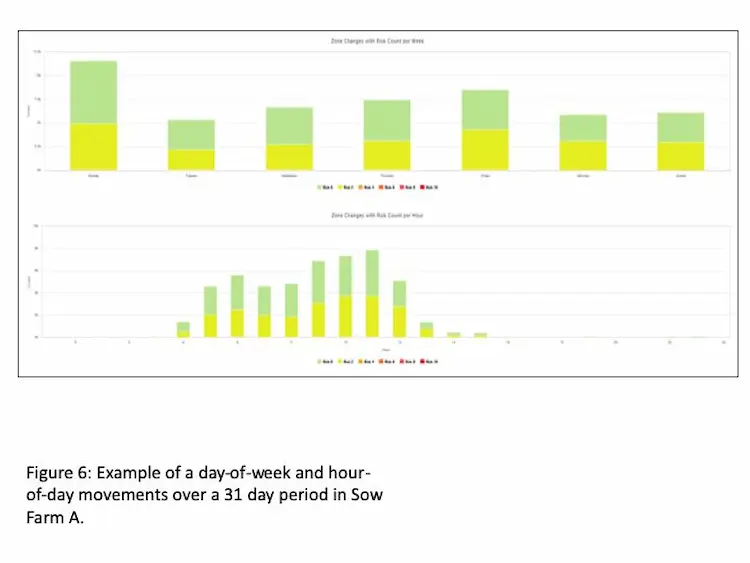
Figure 7 is an instance of a moving scatter diagram of the origin zone-to-destination zone. The bubble color corresponds to the specified zone-zone risk level, and the bubble size corresponds to the number of moves for each corresponding Zone-zone pair.
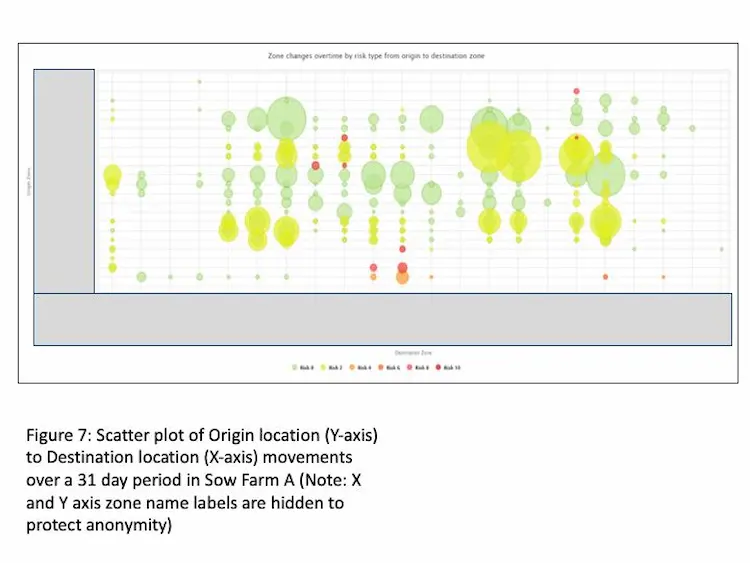
These images can help users identify the date, time, and location of the unexpected high-risk movement of assets and/or people. This knowledge can help production managers work better with others to mitigate and manage the risk of disease transmission and transmission within and between sites throughout the production network.
Conclusion
The beacon system holds promise as a means of simultaneously recording various forms of movement of associated people and assets, providing potential for improved understanding of the risks of disease introduction and transmission within and between sites in the production network. MOKOBlue will further enhance existing technologies and integrate other IoT technologies into the platform. As this and other implementation work progresses, it is anticipated that there will be an opportunity to assess the platform’s investigative contribution to understanding the introduction and sustained transmission of disease sources within and between farms.
